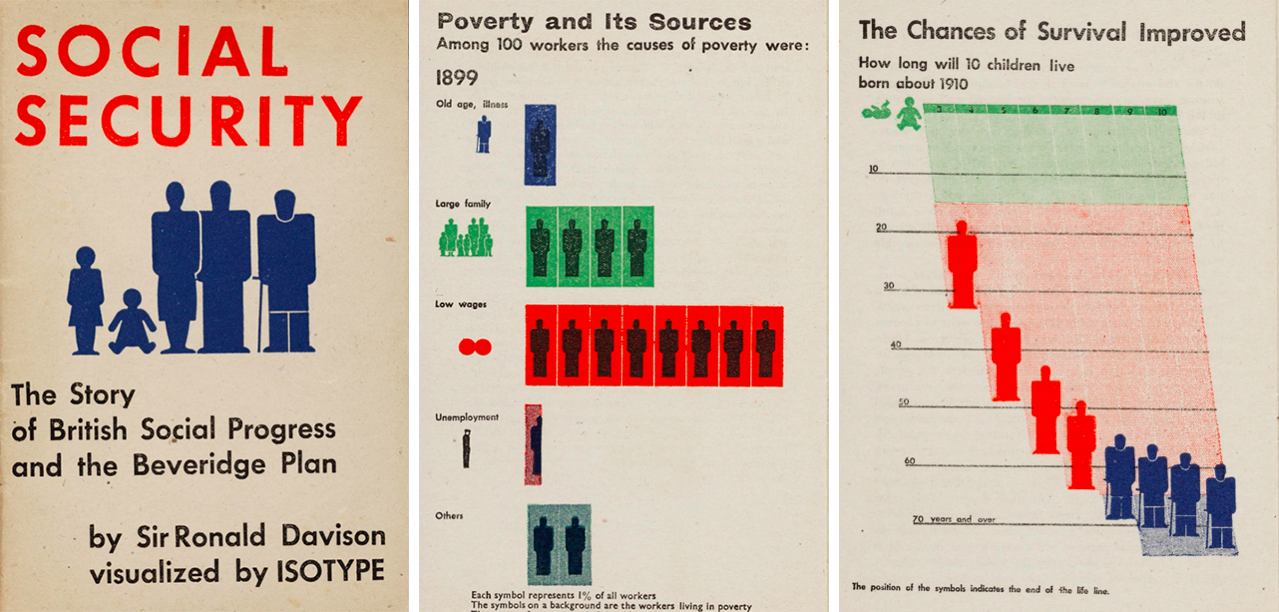
I have an affinity (indeed a healthy envy) for researchers with steadfast missions. Jason Forrest is such a person with a passion for data, currently one of the world’s most valuable commodities. A musician, data visualization specialist, writer, and designer at McKinsey & Co. in New York City, where he designs everything from Dataviz dashboards to chronographic murals. He is the editor-in-chief of Nightingale, the journal of the Data Visualization Society, which publishes articles exploring data visualization and information design from a very wide lens. After writing extensively about the data visualizations of W.E.B. Du Bois for the 1900 Paris Exposition, Forrest continues to explore historic data visualization in the early 20th Century, which led to fervent interest and work on Isotype (International System of Typographic Picture Education), the symbolic language developed in Vienna between 1925 and 1934 as a universal sign language to communicate complex statistics and data in accessible visual ways. He is working on a book tentatively titled The Rules of Isotype (I reviewed another excellent book, Isotype: Design and Contexts 1925–1971 by Christopher Burke, Eric Kindel and Sue Walker, published in 2014).
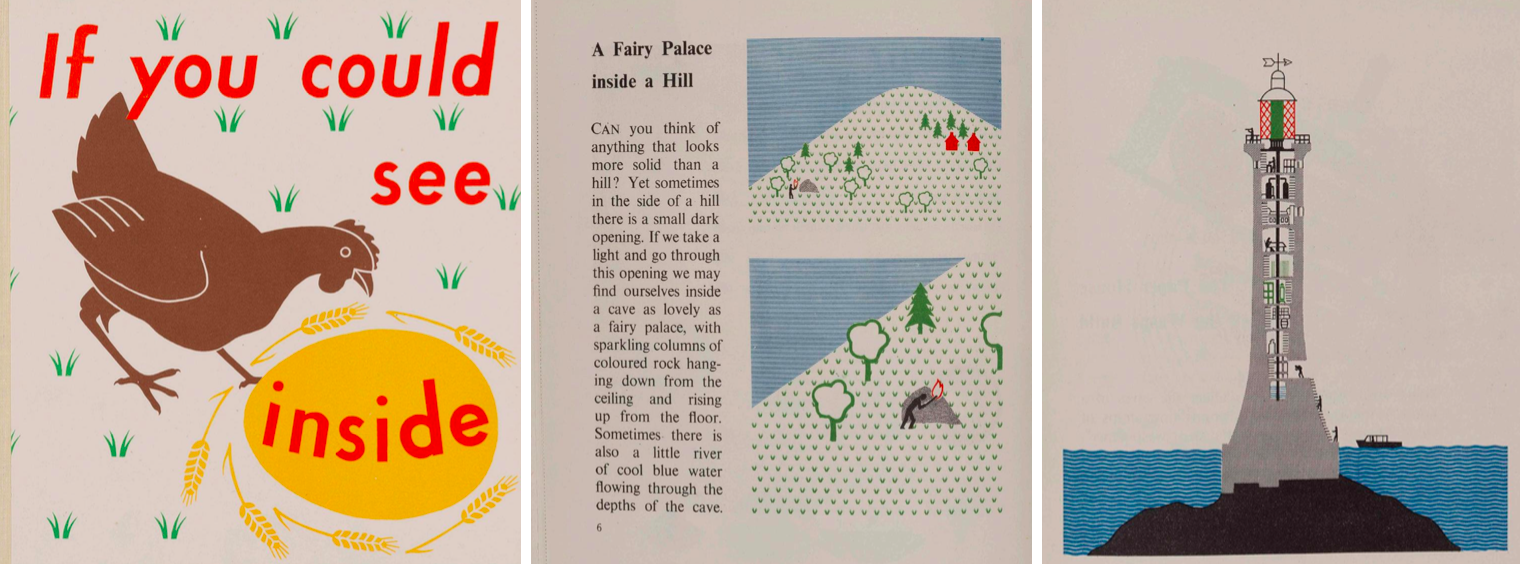
Forrest is amassing a curated archive of vintage data visualization books and artifacts, which he plans to make digitally available to the public. His interest in writing about Isotype is multifaceted. “On one hand, I would like to explain the design concepts of Isotype as a methodology towards reviving the practice today,” he says. On the other, he has “been entirely engrossed by the life-stories” of the inventor of the Vienna Method of Pictorial Statistics, Otto Neurath and its main practitioners, including Marie Neurath (below is her children's book "If You Can See Inside"), Gerd Arntz, and Rudolf Modley, “as their paths follow the triumphs and turbulence of the twentieth century in sweeping arcs of innovation, loss, and invention.”
Since Otto Neurath is renown in both philosophy and design history, Forrest “felt a need to truly immerse myself in the world of Isotype,” he says. “As a result, I have collected the charts for 57 Isotype books, 19 books by Rudolf Modley, and over 180 hundred research papers and articles about Isotype and pictorial statistics in general. “The story and practice of Isotype is just so fascinating that it deserves to be understood in a pragmatic, personal way that honors it's originators and frees the practice of its history.” His articles are here.
The collection is what he calls a “byproduct of his aim to explain the rules of Isotype," how the lives of its four creators impacted how pictorial statistics came into being, then share full sequences from the books in high quality. “I see no reason why the concepts in Isotype can't be revived and used today to create new work,” he asserts. All the elements from the original team can be found in various design and data science practice, it's just a matter of tying together the mindset, techniques, and design process. “I believe that part of a potential revival would revolve (in some part) around access to an archive of the original work.”
Forrest’s notes that his most important discovery is the 250 pieces in the Telefact collection, which he proudly asserts is “completely unique, unknown, and ‘new.’” Telefact was a syndicated series of Isotypes nuggets by the Pictograph Corporation Inc., founded in 1934 by Rudolf Modley (1906-1976). Modley, the most prolific Neurath disciple in the United States, was an Austrian-American research executive, graphic designer, management consultant and author; he illustrated and wrote a series of books on pictorial statistics and pictorial symbolism (including the perpetually-in-print Dover classic Handbook of Pictorial Symbols. Modley is duly credited for popularizing the Isotype picture language in the United States, and contributed his own version of pictorial statistics. He also designed many pictorial symbols in the 1930s and 1940s, and worked on standardization of pictorial symbols. Forrest discovered these images in various newspapers; they laid the groundwork for today’s prodigious use of infographics. For more.
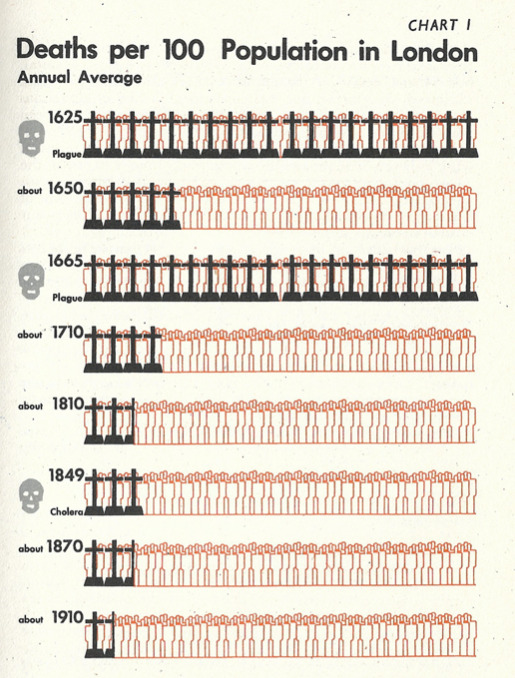
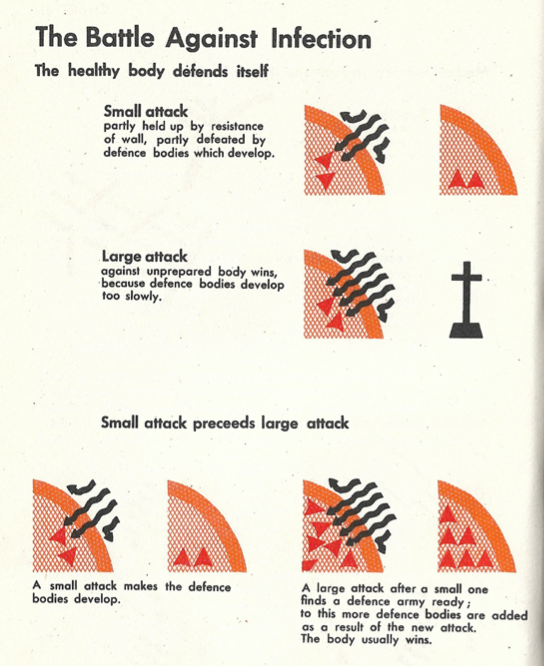
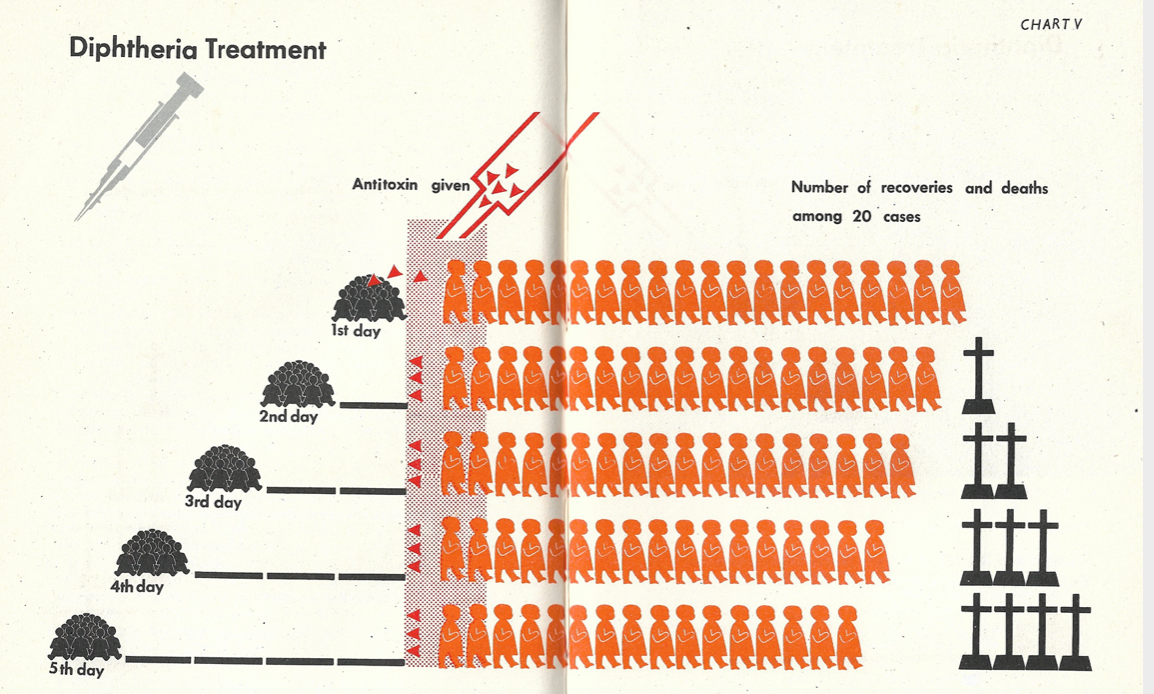
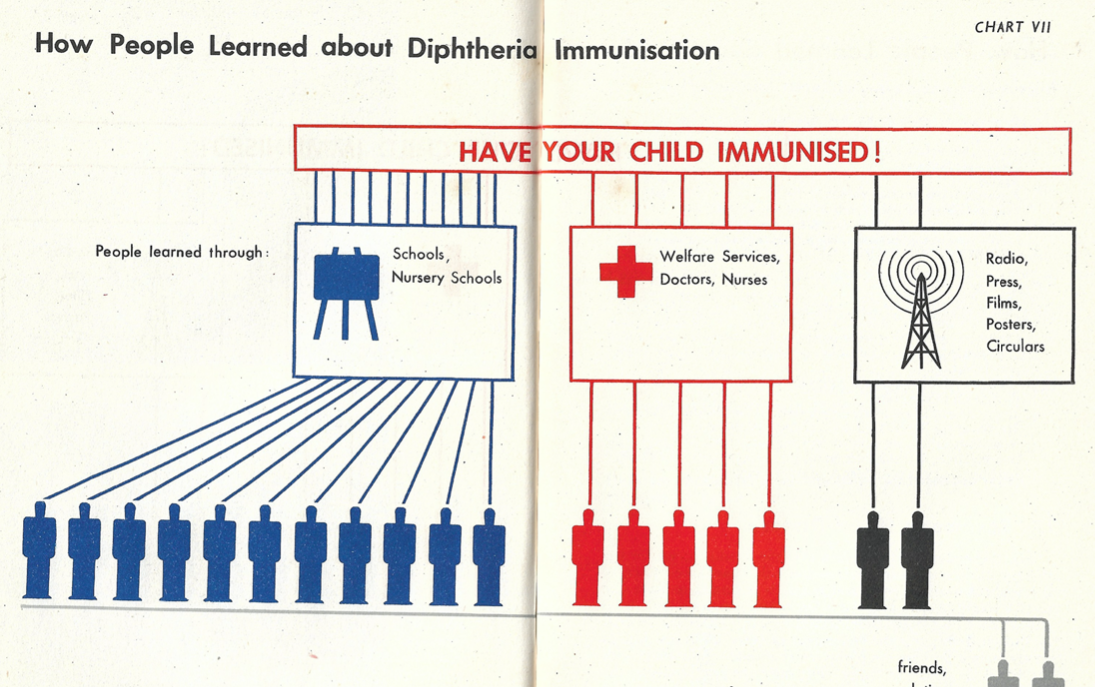
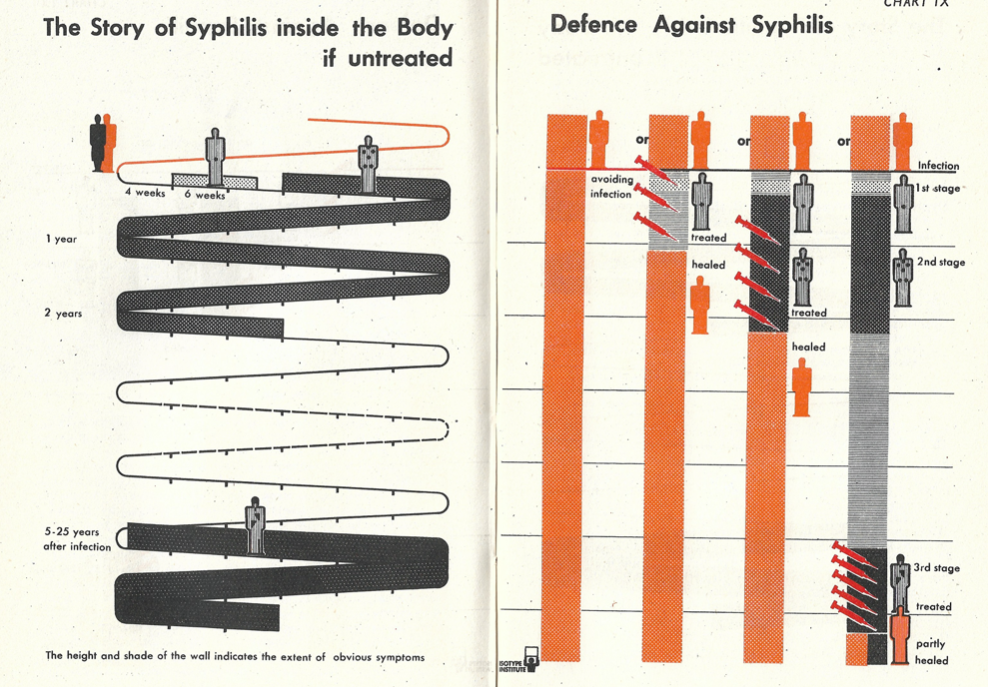
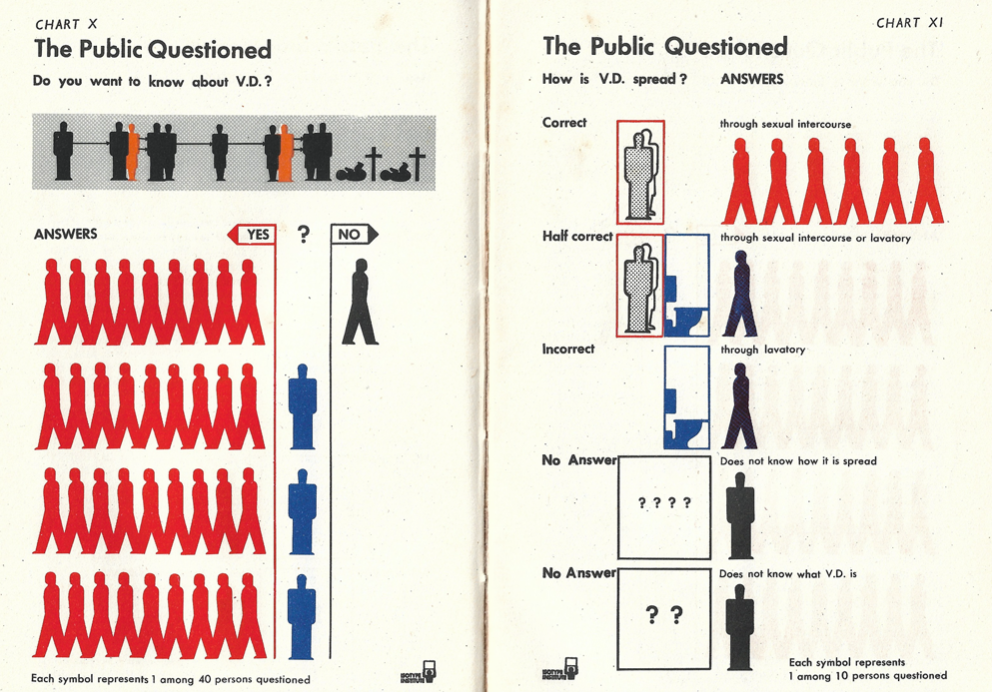
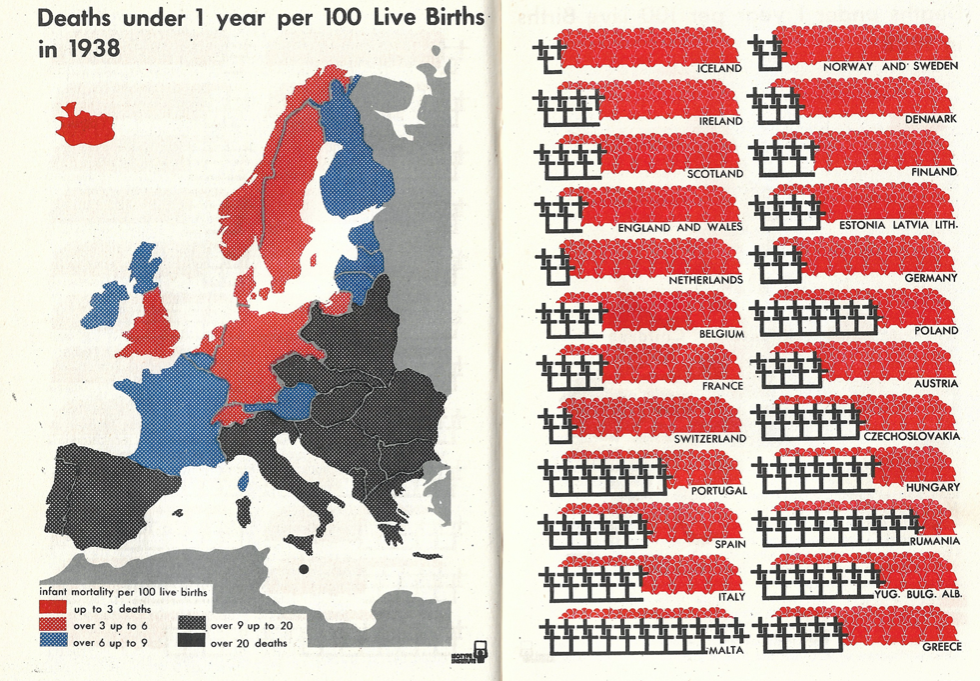
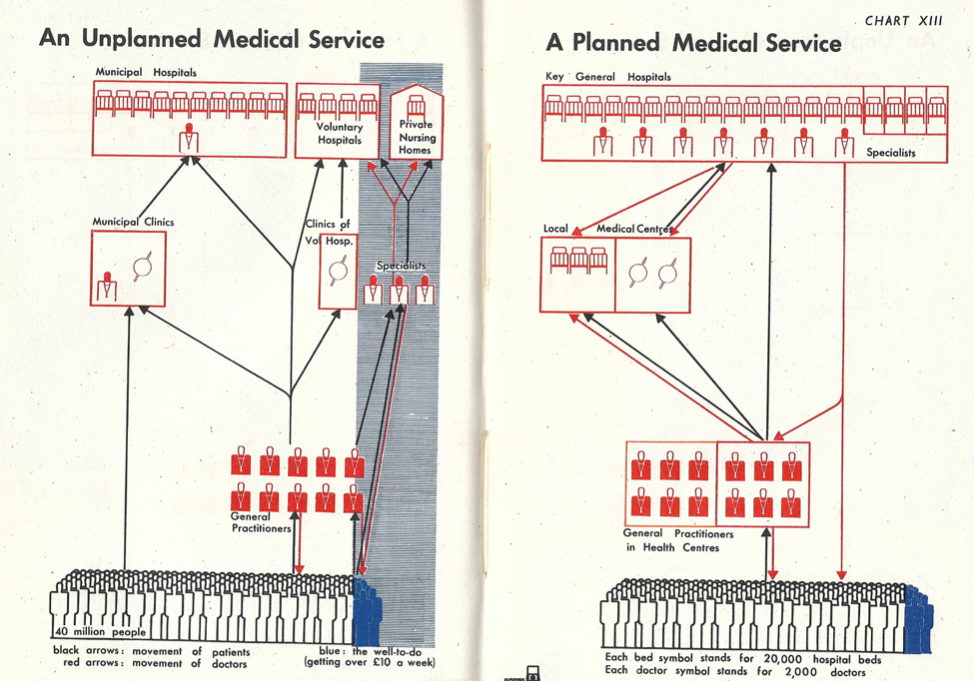
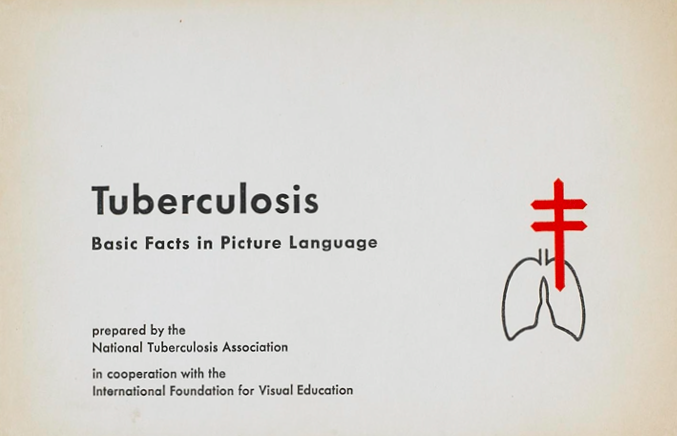
Today, in the midst of a global pandemic, Neurath’s work in addressing public health is particularly relevant. Among the treasures in Forrest’s collection is a volume about to the Covid19 of its day, the 1939 Tuberculosis, produced for the National Tuberculosis Association and designed by Neurath’s International Foundation for Visual Education. Another, recently obtained, is The Battle for Health: A Primer for Social Medicine by Stephen Taylor and charts by Isotype Institute (Nicolson and Watson, London), addressing the threats consequences of infectious diseases.
Doubtless, Covid19 will be a call to the current generation of data visualizers and these earlier volumes that Forrest and others are archiving will be invaluable models for how to chart, track and, with luck, prevent this surfeit of emerging problems.



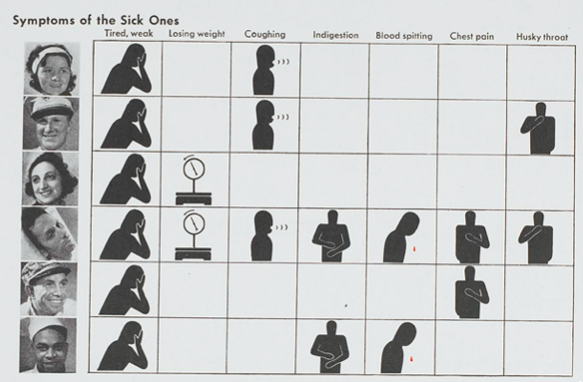

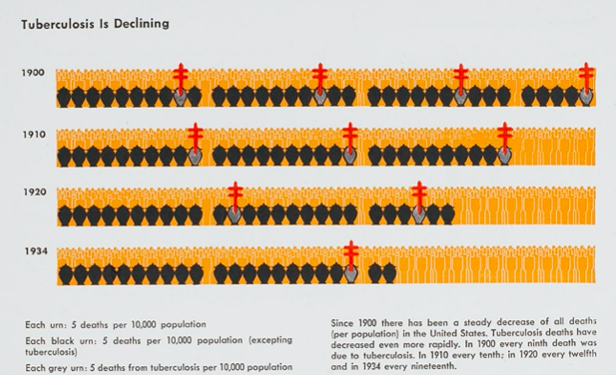
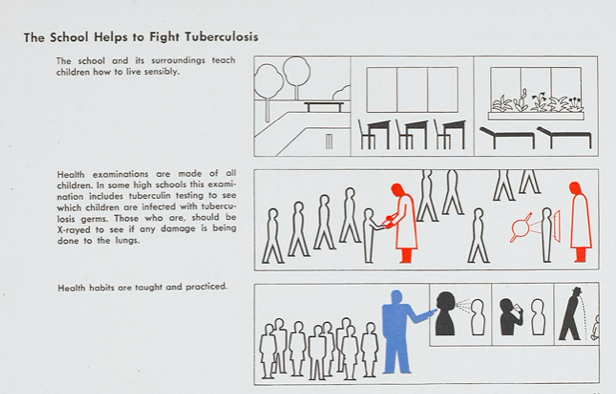
Below pages from: The Battle for Health: A Primer for Social Medicine by Stephen Taylor and charts by Isotype Institute (Nicolson and Watson, London).
